


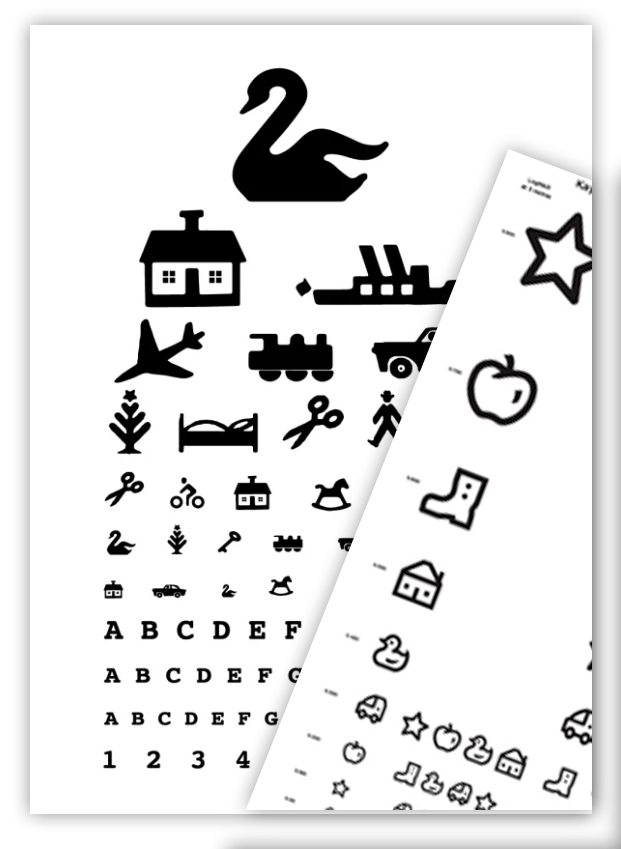
Optotypes for Children – A Science of Its Own
Eye Charts for Children Often Have Serious Flaws
An Unregulated Market
The market for children’s eye charts is largely unregulated, leading to inaccurate and overly favorable vision test results for children, which can result in missed referrals and lack of treatment. Unfortunately, it is entirely up to the manufacturer to determine the compensation that figure-based optotypes should have to produce what the manufacturer considers appropriate test results.
Research and Measurements Document the Problems
Research shows that there is often no scientific basis for the compensations that manufacturers apply to their figures. This leads to figure-based vision charts overcompensating to such an extent that many children’s vision problems are only detected when they are old enough to be tested on a chart with letters, such as Tumbling E or similar.
Charts that give children good vision test results are mistakenly considered “good” charts.
However, the purpose of a vision test is not to ensure that all children “pass” but to identify vision problems that require further investigation and treatment.
In Denmark, the Østerberg chart has been particularly problematic.
Internationally, charts like Kay Pictures consistently use figures (optotypes) that are exactly 200% larger than the corresponding letters on adult charts. International research and ISOeyes’ own studies suggest that the compensation factor should be around 122%—a significantly smaller factor that would ensure comparable vision test results between Kay Pictures figure-based charts and ETDRS charts with letters.
The Lea chart does not overcompensate to the same extent and only produces minor deviations from the results provided by an ETDRS, Tumbling E, or Landolt C chart.
The Compensation Factor
Figures are more complex for the eye to decode, so some compensation is indeed necessary. However, it’s not enough to apply the same rules across different optotypes. There are still several “rules of the game” that must be followed.
Based on the charts produced by ISOeyes, studies and tests have shown that comparable vision test results are achieved with a compensation of 122%.
This gives the following compensation::
- On a 3-meter chart, the height of a letter on the 6/6 (LogMAR 0.0) line should be 43.63 millimeters.
- On the same 3-meter chart, the height of a figure on the 6/6 (LogMAR 0.0) line should be 53.61 millimeters.
But Why Is Compensation Necessary?
– On Anatomy and Extremities
ISO 8596, as well as the guidelines from health authorities, prescribes that figures on vision test charts should be line drawings and not solid figures, like those on the Østerberg chart. This is because line drawings, in their construction, resemble the anatomy of a letter more than a solid figure does. When figures resemble letters more closely, the need for compensation is reduced. However, there are a few problems that many overlook in the production of vision charts.
- Line drawings often become too thin in stroke thickness and do not comply with the “5 minutes of arc” rule for line thickness. This means the figures appear thinner than letters, making them harder to identify during the vision test. While this can be compensated for, it is not always done with enough care to ensure that vision test results are comparable to those from other charts.
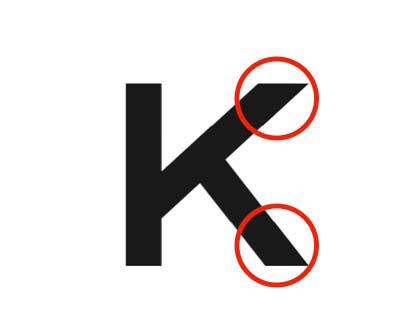
- The choice of figures and their design, even when we are talking about line drawings, is also of great and often overlooked importance. If we look at the letter “K” and compare it to a line drawing of a house, it becomes clear that anatomically they are very different. While the “K” is open and, so to speak, sticks out in all directions, the house is a closed figure. When something sticks out—has extremities—it becomes easier for the human eye and brain to decode and remember. Far easier than with a closed figure without significant extremities.
- If line drawings are designed to follow rules for line thickness and resemble letters anatomically, the need for compensation (enlargement) is significantly reduced because they become equally challenging for the human eye. It’s that simple. And only in this way can we provide the human brain with the same “working conditions” and ensure comparable vision test results.
Let’s see an example
The concept of extremities
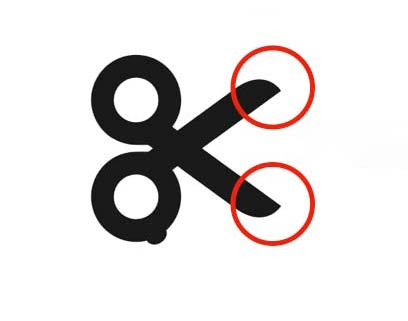
Below you will find 3 objects. One of them has hardly any extremities, while the other two have them—the letter ‘K’ and the scissor.
Distinct extremities
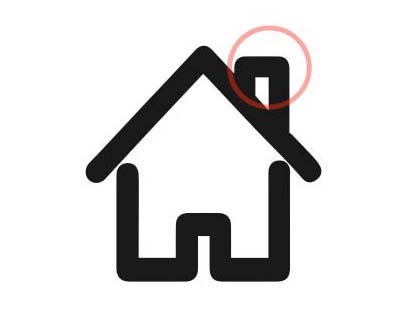
A less distinct extremity in a closed figure
Distinct extremities – in an open figure
Further Development of Eye Charts at ISOeyes
ISOeyes has further developed their popular “eyekey” optotype for even more accurate vision test results.
The goal of screening vision tests must be to conduct accurate and comparable tests to determine whether a referral is needed, regardless of which vision chart the test subject is using.
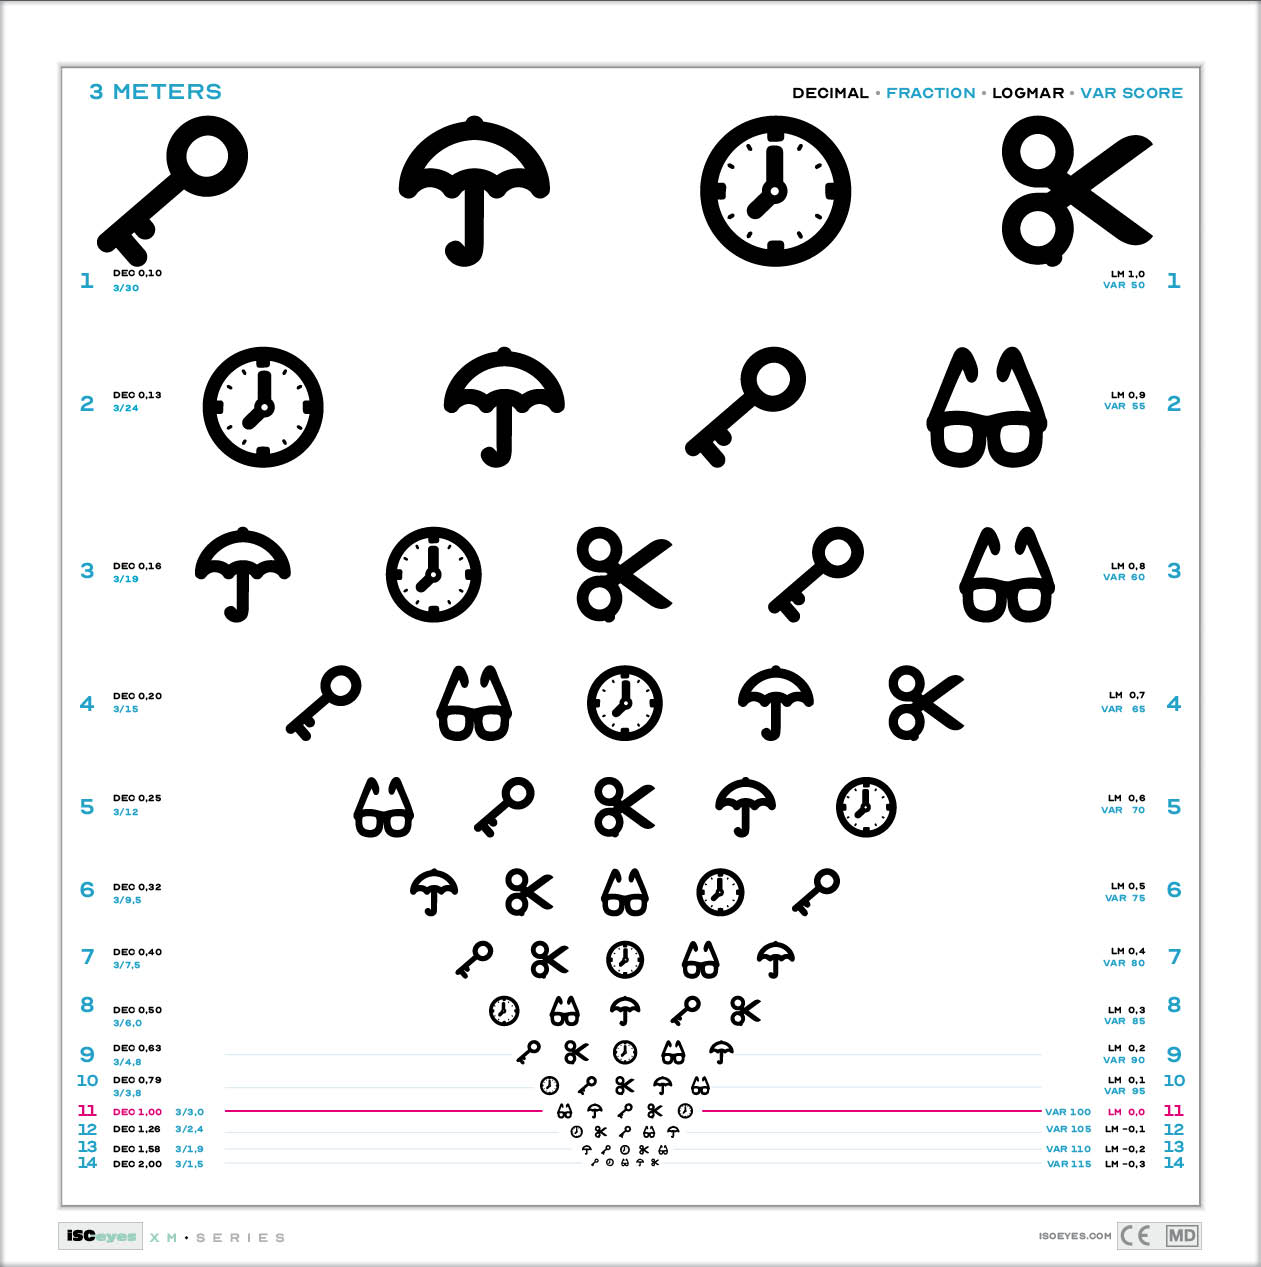
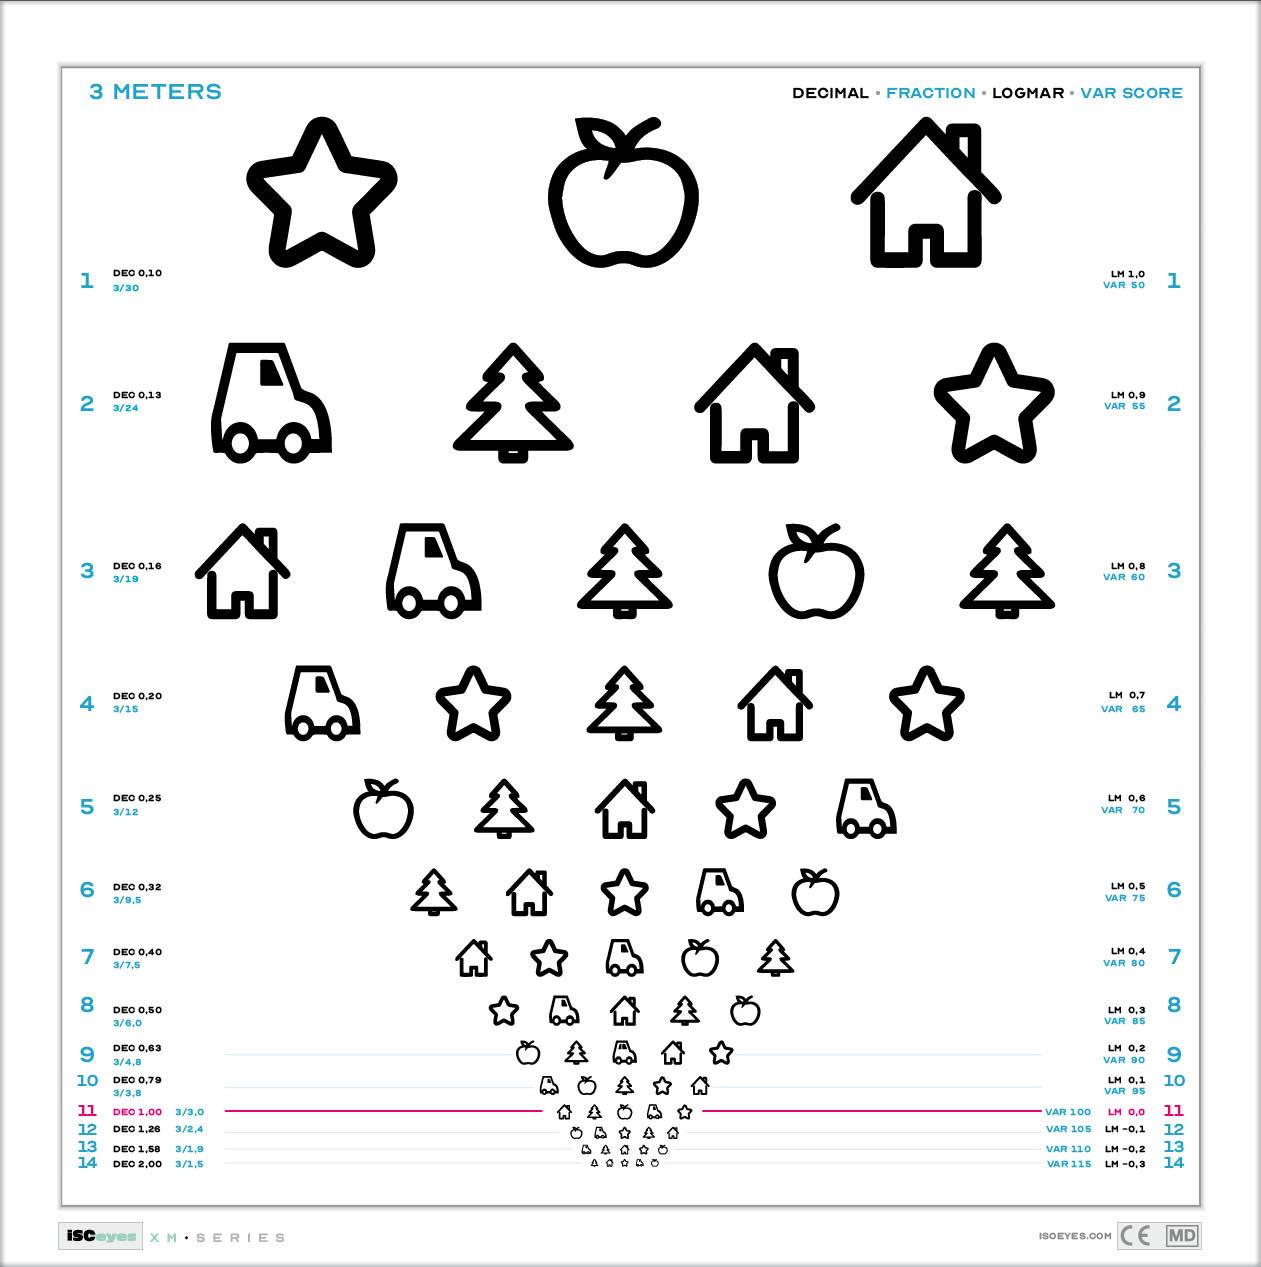
ISOeyes has now developed a new children’s vision chart that offers optotypes that resemble letters more closely than before. In tests with over 206 children, results show that our new “Similar” Optotype series provides even better and more comparable vision test results than our popular “eyekey” series. The “Similar” series is characterized by figures that more closely resemble letters and are not closed in shape. One exception is the clock, but it stands alone and cannot easily be confused with others in the series.
Purchase the new charts with ‘Similar‘ optotypes from your preferred retailer.
Similar – Optotypes used on a 3-meter chart
Eyekey – Optotypes used on a 3-meter chart
![]()