


It is not only the English figure chart from Kay Pictures that, according to recognized research, produces overly favorable vision test results compared to the reference chart from Landolt C (according to ISO 8596). The same is true for the Østerberg chart, which has been widely used in Denmark for decades.
“Two out of three children who need glasses are not detected during routine checks,” says Chief Physician at Roskilde Hospital’s Eye Department, Lisbeth Sandfeld, in an article in the newspaper *Politiken* dated February 7, 2020.
The Østerberg chart, among many other flaws, is inconsistent in its “magnification” of figures, with sizes varying between 60% and 180% larger than the reference size. In the new guidelines from the Danish Health Authority, the Østerberg chart is no longer recommended, but charts from, among others, Kay Pictures are.
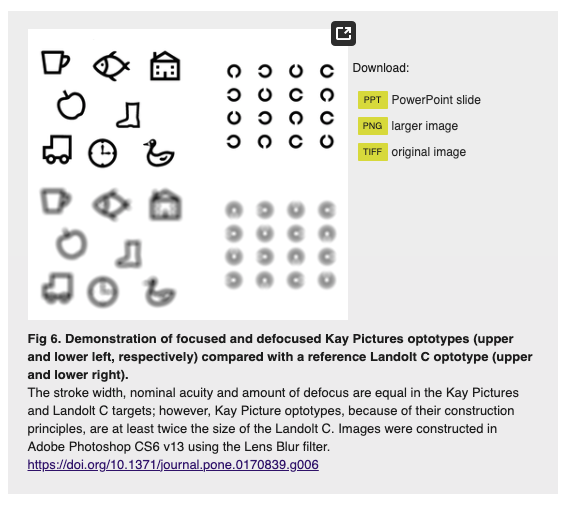
The English Kay Pictures chart uses figures that are precisely double the size (200%) of the reference size of the Landolt C and ISO 8596. This results in a vision test score that is unjustifiably affected by as much as -0.3 LogMAR. Thus, a child who should have scored LogMAR +0.4, and therefore been referred for further examination, scores LogMAR +0.1 on these erroneous charts and unfortunately is not referred. With the Kay Pictures chart, as with the Østerberg chart, there is a risk of failing to detect vision problems in children in time.
If children are consequently registered as being within the normal range on these charts, potential problems are not detected, and no referrals to an eye specialist or other appropriate care are made.
Large New Zealand study on Kay Pictures vision charts concludes: “In summary, we found that the Crowded Kay Pictures vision chart overestimates visual acuity (VA). In its current format, VA results from the Kay Pictures chart should be interpreted with caution when compared with other tests.” Read the full study here: Testing of Kay Pictures vision charts
Kay Pictures has since developed new figures, but has not changed the size of the figures. They are still 200% larger than the Landolt C reference. And why exactly 200%, one might ask? Preliminary test results from studies involving 206 participants suggest that Kay Pictures figures should be no more than 122% larger than the reference to ensure comparability and accurate tests.
There is a lack of guidelines for the use of figure-based vision tests.
Figures are more complex for the eye to decode, so it makes sense to compensate. However, there are no guidelines in place. It seems entirely up to the manufacturer to determine the size without ensuring that vision test results remain comparable!
Summary of the article: “Do picture-based charts overestimate visual acuity? Comparison of Kay Pictures, Lea Symbols, HOTV and Keeler logMAR charts with Sloan letters in adults and children”
Introduction
The article addresses whether picture-based vision charts, including Kay Pictures, Lea Symbols, HOTV, and Keeler logMAR, tend to overestimate visual acuity compared to Sloan letter charts in both adults and children. This study is important because differences in visual acuity measurements between different charts can complicate clinical interpretations and affect the management of visual health, especially in pediatric eye care.
Methods
The study involved comparing visual acuity results from different charts in both adults and children. Participants underwent vision tests using Kay Pictures, Lea Symbols, HOTV, Keeler logMAR, and Sloan letter charts. The primary objective was to identify whether picture-based charts provide higher visual acuity estimates compared to Sloan letters, which are considered the standard.
Results
- Adults: The results showed that picture-based charts, especially Kay Pictures and Lea Symbols, tend to overestimate visual acuity compared to Sloan letters. The overestimation was significant and consistent among adult participants.
- Children: Similar to adults, children’s visual acuity measurements using picture-based charts were higher than those obtained with Sloan letters. The degree of overestimation was more pronounced in younger children.
Discussion
- Chart design and symbol familiarity: The overestimation in picture-based charts can be attributed to the design and familiarity of the symbols used. Pictures are more recognizable and easier for children to identify compared to abstract Sloan letters. This familiarity likely contributes to better performance and higher visual acuity scores.
- Clinical implications: The study emphasizes the importance of caution when interpreting visual acuity results from different charts. For consistent and reliable assessment, it is crucial to use standardized charts, especially in clinical settings where accurate measurement of visual acuity is essential for diagnosing and managing visual impairments.
- Practice recommendations: Clinicians are advised to use letter-based charts like Sloan letters for a more accurate assessment of visual acuity. If picture-based charts are used, especially for younger children, the potential for overestimation should be considered, and the results should be interpreted accordingly.
Conclusion
The study concludes that picture-based visual acuity charts, such as Kay Pictures and Lea Symbols, tend to overestimate visual acuity in both adults and children compared to Sloan letters. This overestimation is due to the familiarity and recognizability of the symbols. For accurate measurement of visual acuity and consistency in clinical assessments, the use of standardized letter-based charts is recommended. This finding is crucial for improving the accuracy of visual health assessments and ensuring appropriate management of vision conditions.
References
Anstice, N. S., Jacobs, R. J., Simkin, S. K., Thomson, M., Thompson, B., & Collins, A. V. (2017). Do picture-based charts overestimate visual acuity? Comparison of Kay Pictures, Lea Symbols, HOTV and Keeler logMAR charts with Sloan letters in adults and children. PLOS ONE. Link to article
Politiken 7. FEB. 2020 KL. 21.29. by Signe Thomsen – Journalist
Iconic Danish vision chart is blamed:Children with poor vision are not detected
Two out of three children who need glasses are not detected during routine checks. Often the vision charts are not good enough. The Danish Health Authority is announcing new guidelines.
In Denmark, all preschool-aged children have their vision tested during annual check-ups with their doctor, and when they start school, the school nurse also examines their vision.
But now a new, large research project involving almost 500 Danish children aged four to seven has shown that a large proportion of children who need glasses are not detected at all. In fact, two out of three children with poor vision pass the vision test without any issues.
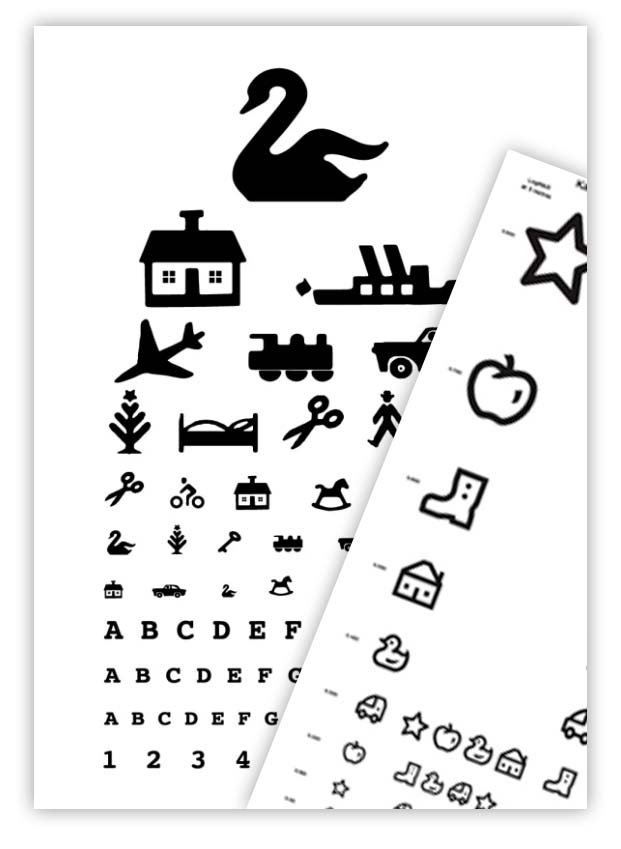
A significant part of the reason is that the most widely used vision chart in Denmark is simply not good enough, explains Chief Physician at Roskilde Hospital’s Eye Department, Lisbeth Sandfeld, who led the research. The chart, known as ‘Østerberg’ and featuring a swan at the top, was designed in 1934.
“We are very fond of it in Denmark because it was invented by a Dane. But it is not up-to-date, and it is no longer used in other countries.”
If instead a chart based on the so-called LogMAR principle is used, 85% of the children who need glasses can be identified. LogMAR charts have line drawings instead of filled symbols, and the drawings are more similar to each other, making them harder to distinguish between, especially for those who are mildly to moderately farsighted, like most of the children with vision problems that are not detected.
“You can make a big difference just by changing the vision charts,” points out Lisbeth Sandfeld.
Additionally, parents, teachers, and caregivers can watch for signs of reduced vision in a child. Children usually do not know themselves that they have poor vision because they have never experienced anything else, so they do not complain about it. However, concentration difficulties and learning problems can be due to a child’s difficulty seeing. Clumsiness, problems with fine motor skills, and a tendency to create disturbances in class are other signs.
“Most of these children probably have had vision problems all their lives, but it only gets discovered much later. Typically, when their problems have grown so large that some adult around the child finally suspects that it might have something to do with their vision,” says Lisbeth Sandfeld.
New rules on the way
The chairwoman of the Health Nurses’ Association, Susanne Rank Lücke, takes the study’s results very seriously.
“It is alarming that we are not finding all the children we should. I can only urge that new vision charts be purchased in the municipalities that still use Østerberg,” she says.
She emphasizes that she knows it is expensive and will likely take years.
“As health nurses, we must therefore focus extra on using the charts we have under optimal light and distance conditions. And we must get used to observing other signs of poor vision in the child, even if it does not show up in the vision test itself.”
The Danish Health Authority reports that it plans to revise the guidelines next year but already recommends LogMAR-type charts when municipalities call and ask.
The chairperson of the professional association for general practitioners, DSAM, Anders Beich, also acknowledges the problem but emphasizes that health authorities must take the lead with a recommendation before doctors change their tools.
![]()