


Transition from fractions to logarithmic measurement
LogMAR values to be used going forward, in accordance with health authority guidelines.
LogMAR | Decimal | Fraction (6/6) | Description
0.0 | 1.0 | 6/6 | This is the reference value for normal vision.
0.1 | 0.8 | 6/7.5 | Minimum visual acuity required for a professional driving license (in the better eye).
0.2 | 0.63 | 6/9.5 | Referral for school children (6 years and older) if visual acuity is less than this in the better eye.
0.3 | 0.5 | 6/12 | Referral for preschool children if visual acuity is less than this in the better eye. (This is also the minimum visual acuity required for a private driving license.)
NOTE: The LogMAR values on the eye chart must increase in precise increments of 0.1 to ensure accurate and comparable results in vision testing. As a result, they do not exactly match the old 6/6 measurements such as 6/9, but instead follow the new LogMAR values. The referral threshold for school children is set to LogMAR 0.2 to maintain the 0.1 increments on the scale, instead of LogMAR 0.17, which corresponds to the old 6/9 threshold.
Do you want even more precision in your recording?
- Each letter or figure that the test subject can identify on a line of the eye chart has a score value of -0.02 LogMAR units. Since there are 5 letters per line (at least in the lowest 5 lines on the eye chart), the total score for a line represents a change of 5 x -0.02 = -0.1 LogMAR units.
- So, if the test subject can see the entire line corresponding to a LogMAR value of 0.3 (equivalent to the “old” 6/12 or decimal 0.5), but can also identify two additional characters on the line below, the visual test result is further reduced by -0.02 points per identified character, resulting in a final visual test result of 0.3 plus 2 x -0.02 = a visual test result of 0.26 LogMAR.
DEFINITION: LogMAR VA = LogMAR value for the best-read line – 0.02 x (number of additional identified optotypes)
Logarithmic – a more accurate and comparable assessment of visual acuity
- A LogMAR eye chart (Logarithmic Minimum Angle of Resolution) is designed to provide a more precise assessment of visual acuity than other methods.
- To ensure that visual test results are consistent and comparable, health authorities recommend the use of logarithmic-based eye charts and reading of visual test results.
- Our senses – both vision and hearing – work on a logarithmic principle scale. When we perceive a sound as slightly louder, it is actually 10 times louder – and if we increase it slightly more, it becomes 10 times louder again. The same applies to our vision.
- With the logarithmic system, the value in the visual test result decreases with better vision and increases with worse vision. In other words, it is the opposite of the decimal measurement system. The better you see, the lower your score in the logarithmic system.
Characteristics of a LogMAR chart:
-
- Optotypes: LogMAR charts have rows of letters or symbols (optotypes) arranged in logarithmic steps, where the letters get smaller and smaller with each row. This means that the visual test becomes progressively more difficult at the same rate for each step down the chart.
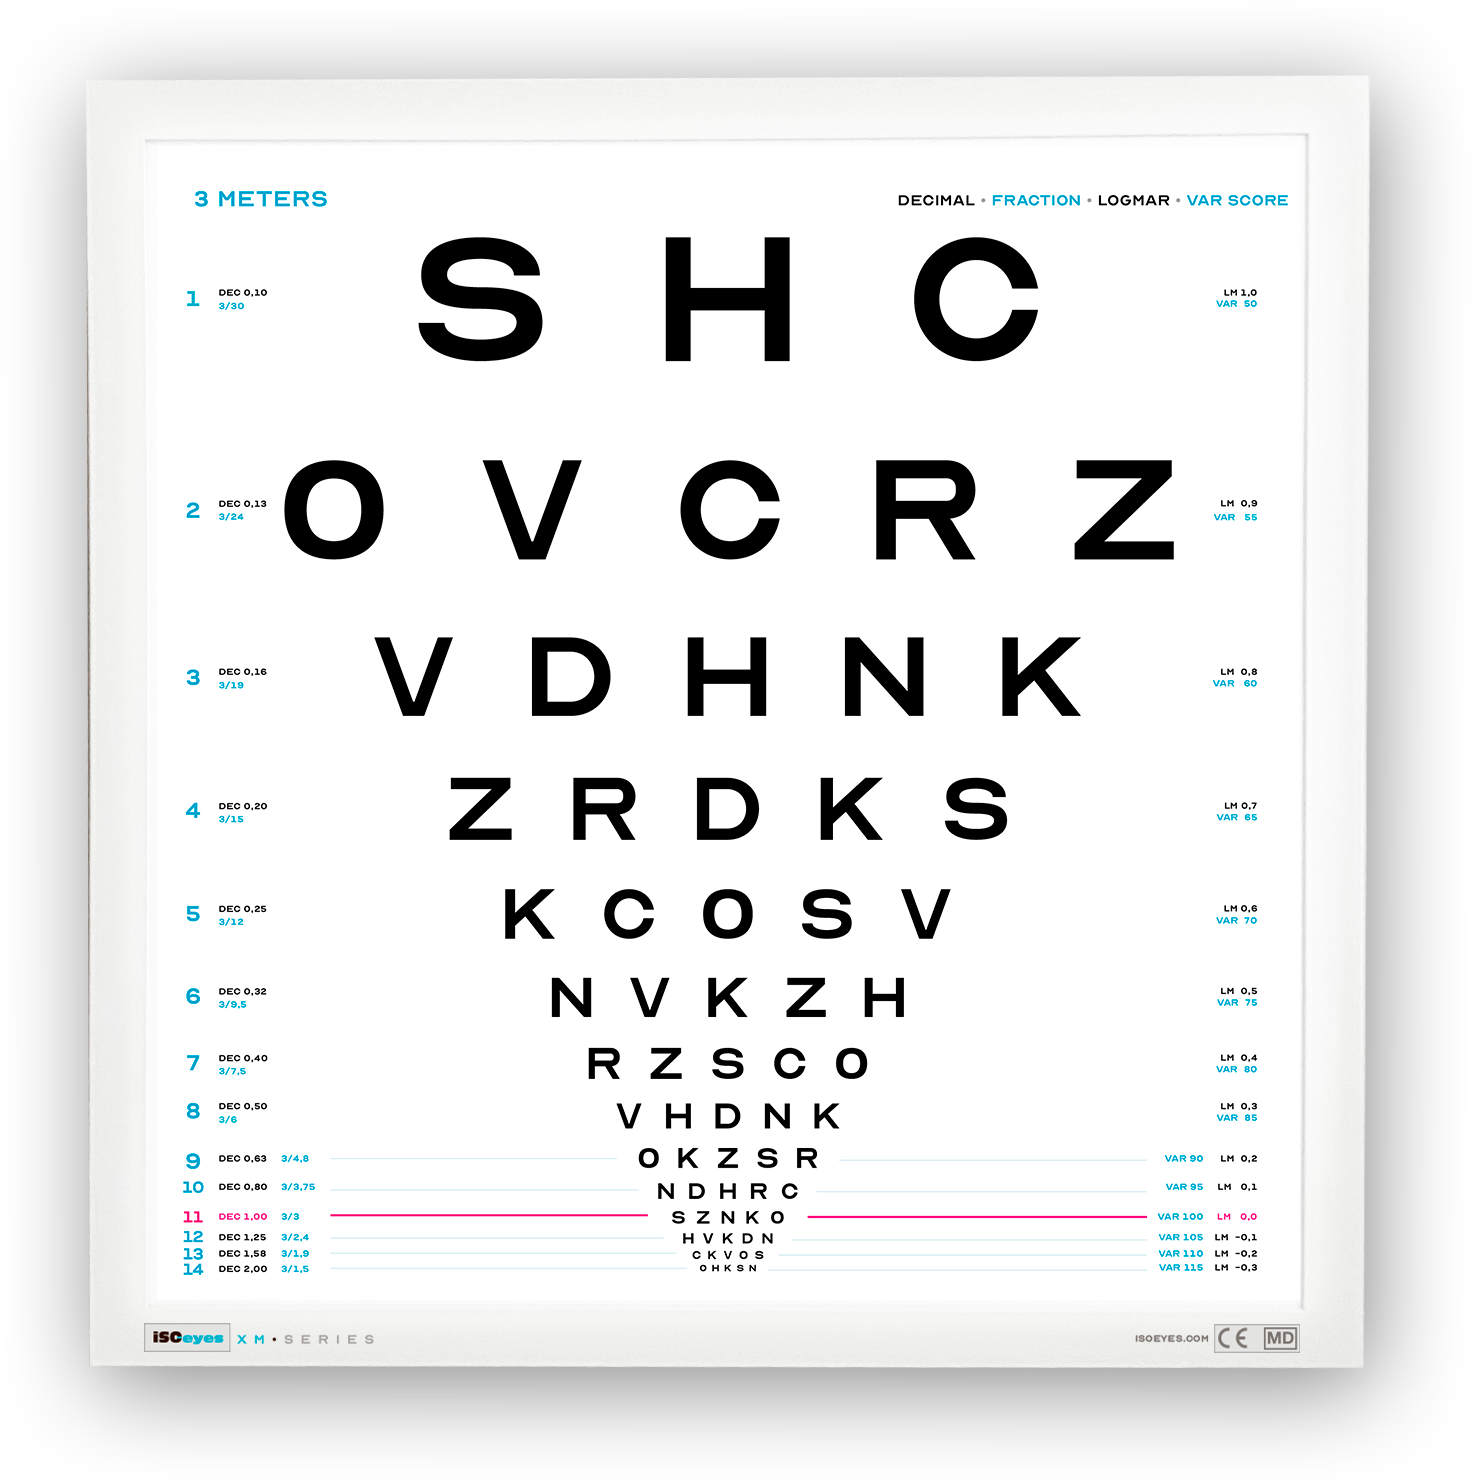
- Logarithmic steps: Each row of letters is precisely 0.1 LogMAR units more difficult to read than the row above. For example, the top row usually starts with large letters (e.g., LogMAR 1.0), and each subsequent row becomes harder by a precise increment of 0.1 (e.g., 0.9, 0.8, etc.). Yes, it becomes exactly 10 times harder to see the row below. This is not the case with old Snellen charts, where the steps are often arbitrary and can vary significantly from manufacturer to manufacturer. This makes real comparison impossible. It is not enough to apply logarithmic values to existing charts with arbitrary steps. The charts must be designed from scratch based on logarithmic principles!
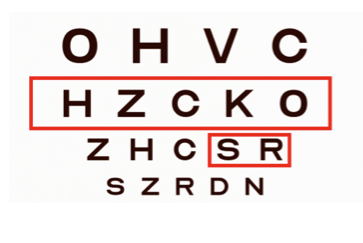
- Crowding effect: To ensure comparability, the letters are closer together on each row rather than arbitrarily spaced, making it harder to distinguish the letters, thereby leading to more accurate results. Why? Because the real world is crowded…
- Below you can see an example of a logarithmic eye chart from ISOeyes. Note that the ‘old’ values are still printed on the chart to make your transition to the logarithmic measurement system more familiar.
Explanations
Preschool Children
Visual acuity: Preschool children (under 6 years) should be referred to an eye specialist if their visual acuity is worse than 0.3 LogMAR (equivalent to 0.5 decimal or 6/12) in the better eye. Preschool children have a slightly higher tolerance for lower visual acuity since their vision is still developing, while school children are expected to have more stable vision.
School Children
Visual acuity: School children (6 years and older) should be referred to an eye specialist if their visual acuity is worse than 0.2 LogMAR (equivalent to 0.63 decimal or approximately 6/9) in the better eye.
The number of referrals will likely increase
Doctors and healthcare professionals should expect to identify significantly more children with vision problems when switching to logarithmic eye charts, which use correctly sized optotypes instead of the oversized figures on older charts. Additionally, the number of referrals may increase as more children experience significant near-sightedness due to excessive screen and smartphone use.
Other Considerations
- Binocular vision (the ability for both eyes to work together) is closely monitored in both age groups.
- Any sign of strabismus, lack of focus, or other visual problems should lead to a referral, regardless of the child’s age.
Private Drivers
- Visual acuity: Private drivers must have a visual acuity of at least 0.3 LogMAR (equivalent to 0.5 decimal or 6/12) in the better eye, either with or without correction (glasses or contact lenses).
- Field of vision: The field of vision must be at least 120 degrees horizontally and at least 50 degrees to each side of the midline in both eyes.
- Double vision (Binocular visual acuity): Functional binocular vision is not an absolute requirement for private driving, but the vision must be sufficient for safe driving.
- Night blindness and color vision: There are generally no specific requirements for color vision for private driving, but it may be relevant under certain driving conditions, such as night driving.
If vision does not meet the requirements without correction, glasses or contact lenses may be necessary, and this will be noted on the driver’s license.
Commercial Drivers
- Visual acuity: Commercial drivers must have a visual acuity of at least -0.1 LogMAR (equivalent to 0.8 decimal or 6/7.5) in the better eye and at least 1.0 LogMAR (equivalent to 0.1 decimal or 6/60) in the weaker eye. This can be with or without correction (glasses or contact lenses).
- Field of vision: The field of vision must be at least 120 degrees horizontally and at least 50 degrees to each side of the midline in the field of vision.
- Double vision: Functional binocular vision is generally required, meaning both eyes must work together to ensure depth perception.
- Color vision: Color vision requirements are not standard for commercial drivers in Denmark, but may be relevant for certain job functions that require accurate color perception.
Correction with glasses or contact lenses is allowed as long as it meets the visual requirements, and this will be noted on the driver’s license. If vision deteriorates below the specified LogMAR values, a commercial driving license cannot be issued or renewed.
NOTE: Many doctors and healthcare professionals often wonder why the rows of letters or figures on a logarithmic eye chart, designed with an inverted pyramid structure, gradually come closer and closer together.
The reason is that this design ensures that it is proportionally just as challenging for the human eye (and brain) to distinguish between symbols at each step. This is called the Crowding effect, and it must be respected to ensure a valid vision test. If there were more and more space around the letters on a row, it would become relatively easier for the eye to detect them, leading to inaccurate test results.
On a European level, ISO standard ISO 8596 has been established with the participation of 32 countries, including Denmark, the USA, Australia, and the United Kingdom. This standard regulates the development of logarithmic eye charts.
Eye charts from ISOeyes fully comply with this ISO standard, which also serves as the basis for the new health authority guidelines.
Measurements unit – how they correspond:
| LogMAR | Snellen Fraction (6/x) | Decimal Value | VAR Score |
|---|---|---|---|
| 1.0 | 6/60 | 0.10 | 0 |
| 0.9 | 6/48 | 0.125 | 5 |
| 0.8 | 6/38 | 0.16 | 10 |
| 0.7 | 6/30 | 0.20 | 15 |
| 0.6 | 6/24 | 0.25 | 20 |
| 0.5 | 6/19 | 0.32 | 25 |
| 0.4 | 6/15 | 0.40 | 30 |
| 0.3 | 6/12 | 0.50 | 35 |
| 0.2 | 6/9.5 | 0.63 | 40 |
| 0.1 | 6/7.5 | 0.80 | 45 |
| 0.0 | 6/6 | 1.00 | 50 |
| -0.1 | 6/4.8 | 1.25 | 55 |
| -0.2 | 6/3.8 | 1.60 | 60 |
| -0.3 | 6/3 | 2.00 | 65 |
![]()